Transfer function analysis with Octave/Matlab
I’ve made a short Octave script (Octave is the open source version of Matlab) which helps a person analyze transfer equations, of the form
|
1 |
A(s) = [DC gain * zeros]/[poles] |
The control toolbox in Octave is great and offers lots of nice ways to plot a transfer function, including highlighting the poles and zeros in an x-y plane to help with placing compensation poles, or just producing normal Bode plots. However it can be confusing and time consuming to put the desired function into the format Octave needs. This is important for anyone building amplifiers with feedback to prevent unwanted oscillations and instability, and also figure out what the gain is at different frequencies. The graphs can highlight the gain margin and phase margin for pinpointing causes of instability.
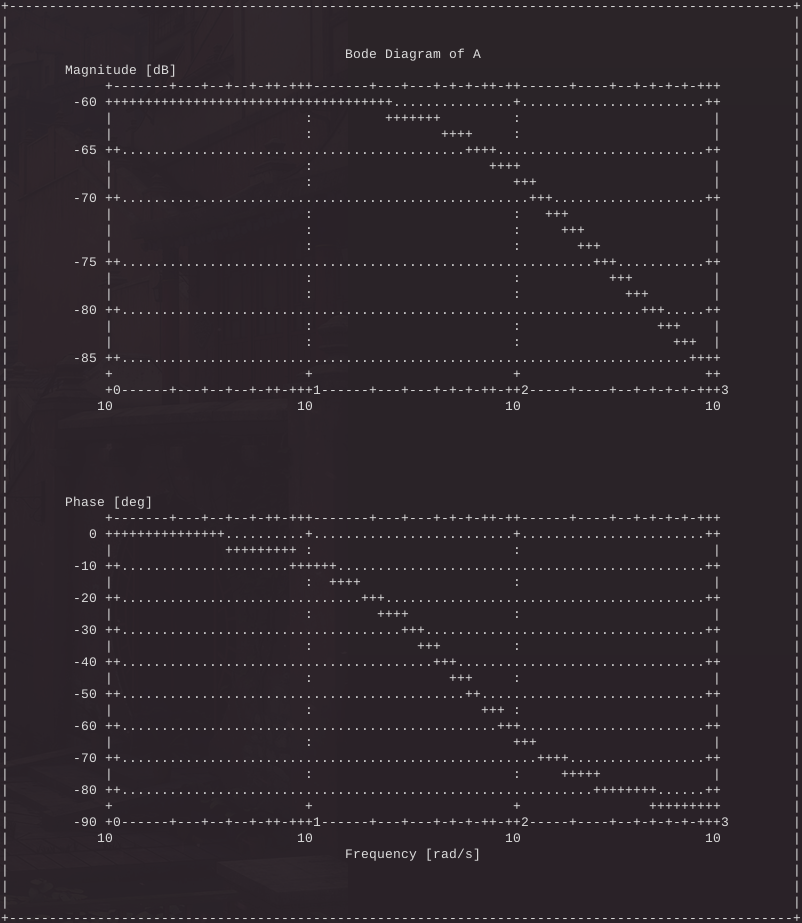
GNUplot drawing a Bode plot in the terminal using ASCII characters.
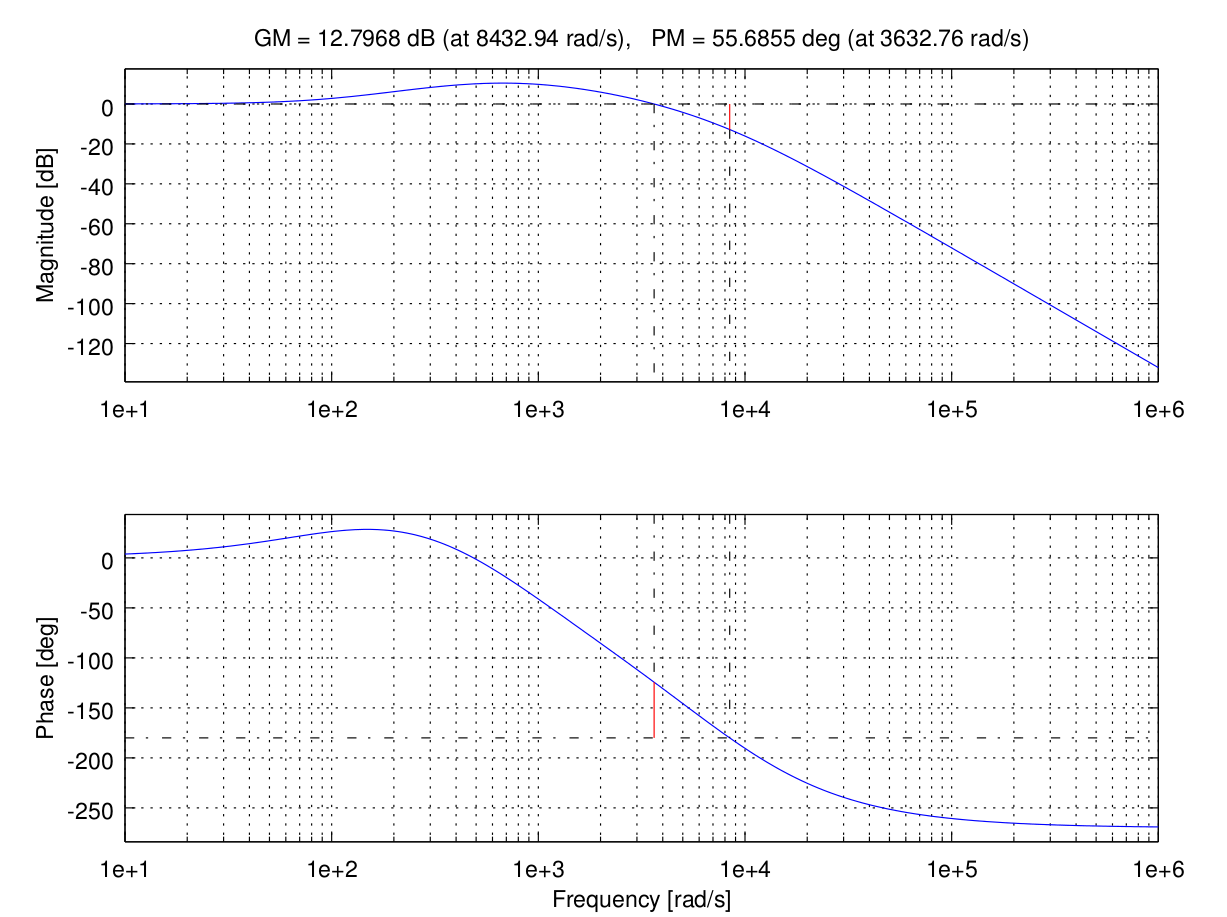
Gain margin and phase margin of a transfer function (a lowpass filter).
This program was originally created as part of an overnight hackathon. The code is available here on my git and I welcome any advice, pull requests or questions!